
LOGISTICS TECH STANDARD
Through the AX of trucks, LTS reports safety and carbon data to primary logistics contractors in real time
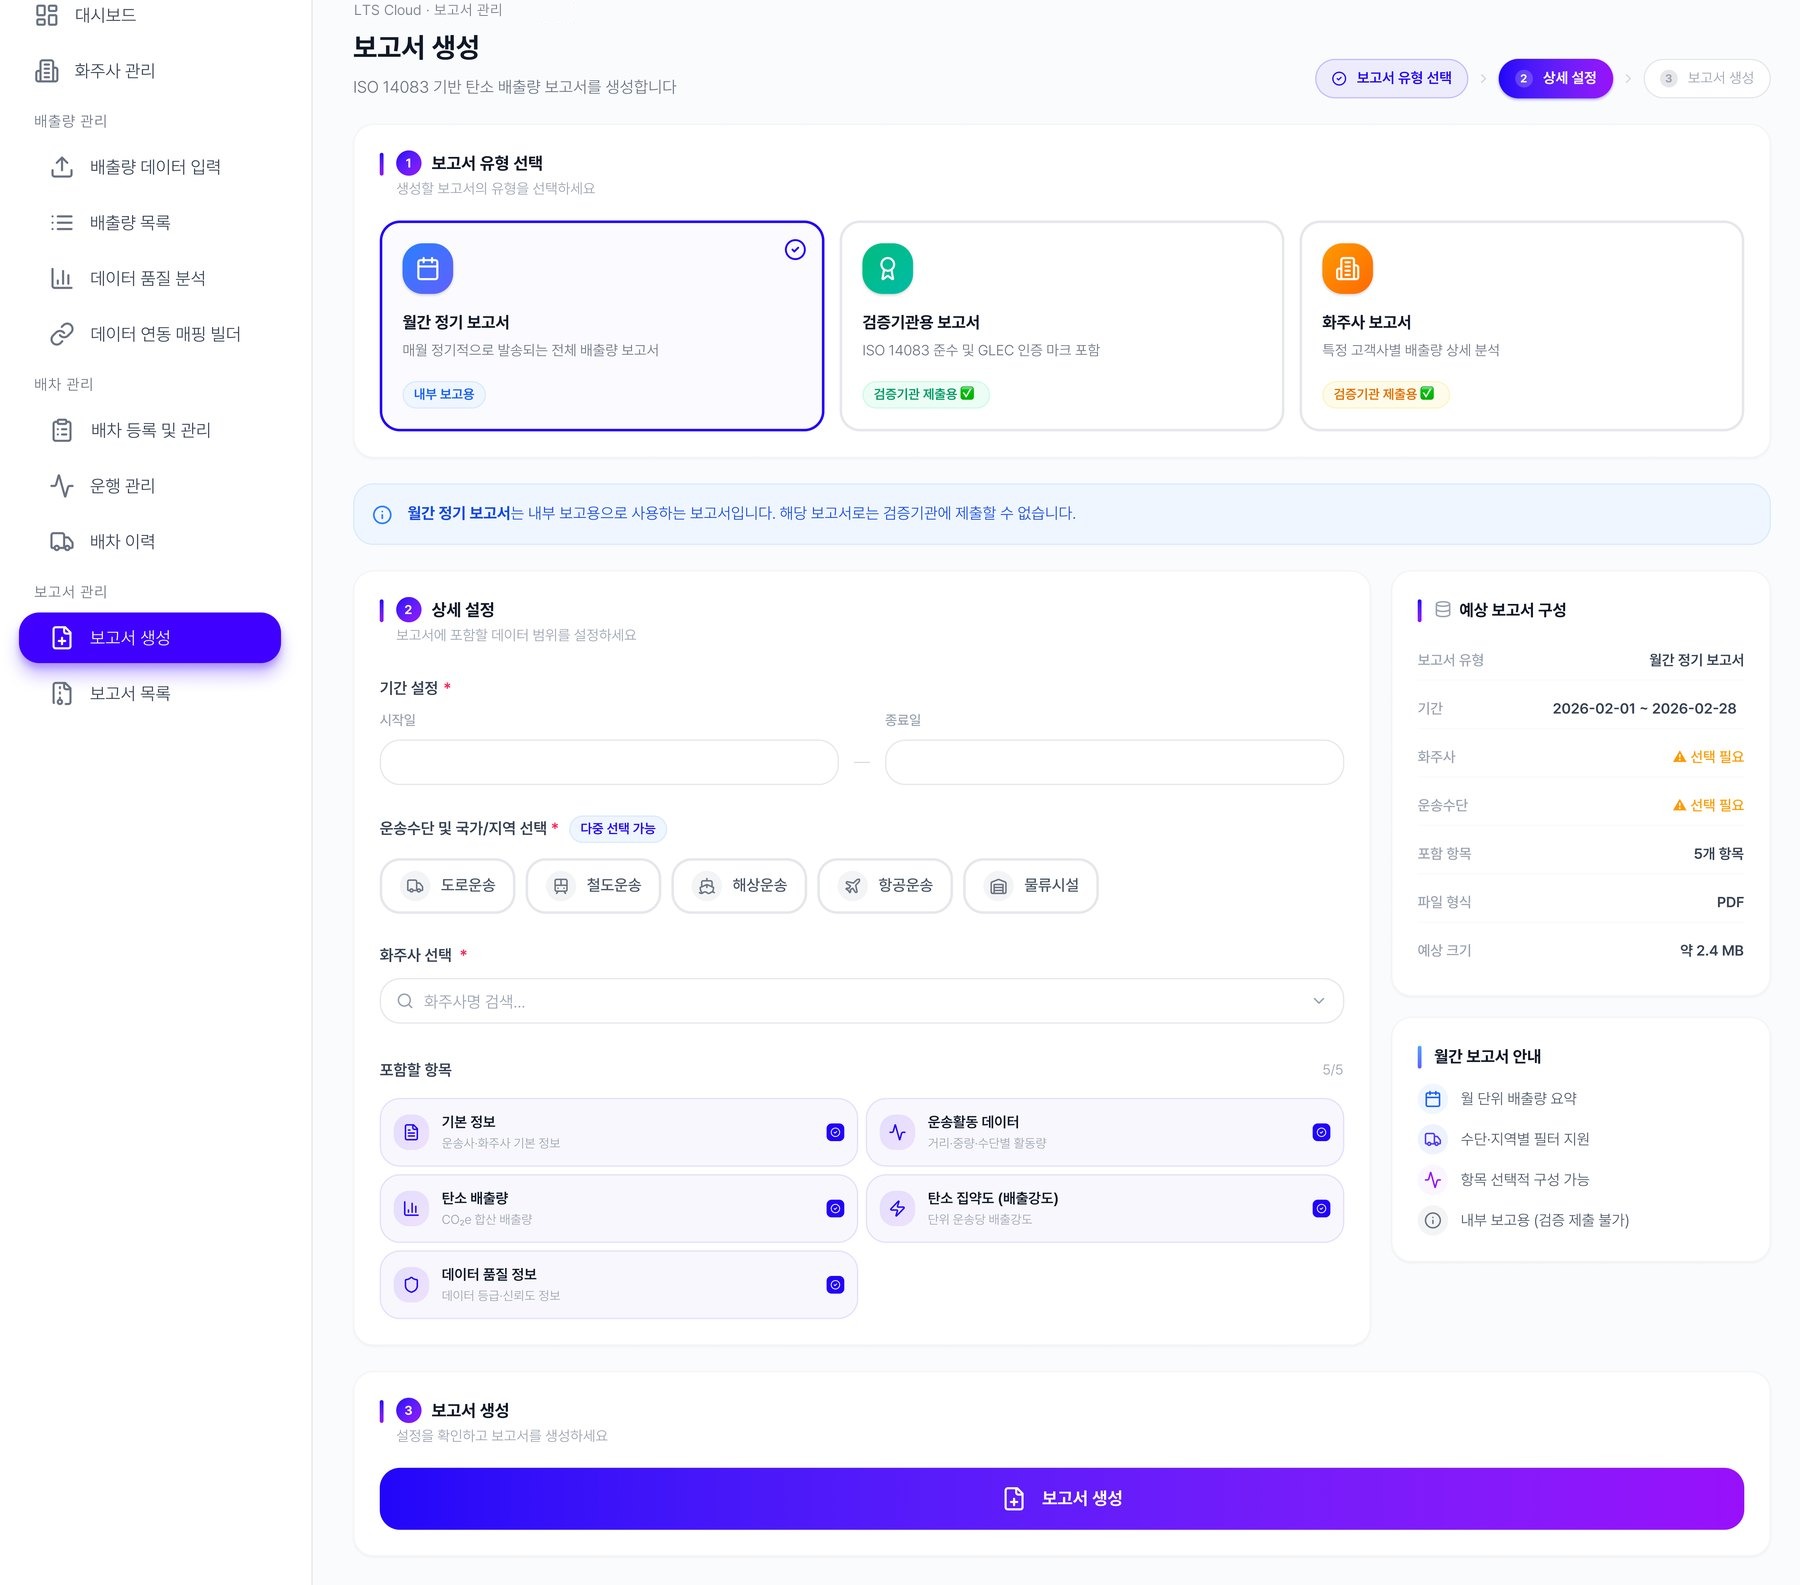
Primary logistics contractors receive the part of their partner carriers' truck trip, fuel, electricity and risky-driving data that covers their own cargo, and use it directly for emissions reporting per shipper and safety monitoring. LTS DTG collects the data on the truck; LTS Cloud then uses the LAS engine to determine which primary contractor receives it and the LCS engine to calculate emissions.
Technology film
How truck trip data becomessafety and carbon reports
Part 1AX · AI transformation of transport data
Problem
90% of trucks are owner-driven and multi-tier subcontractingbreaks collection, so primary contractors estimate, not measure
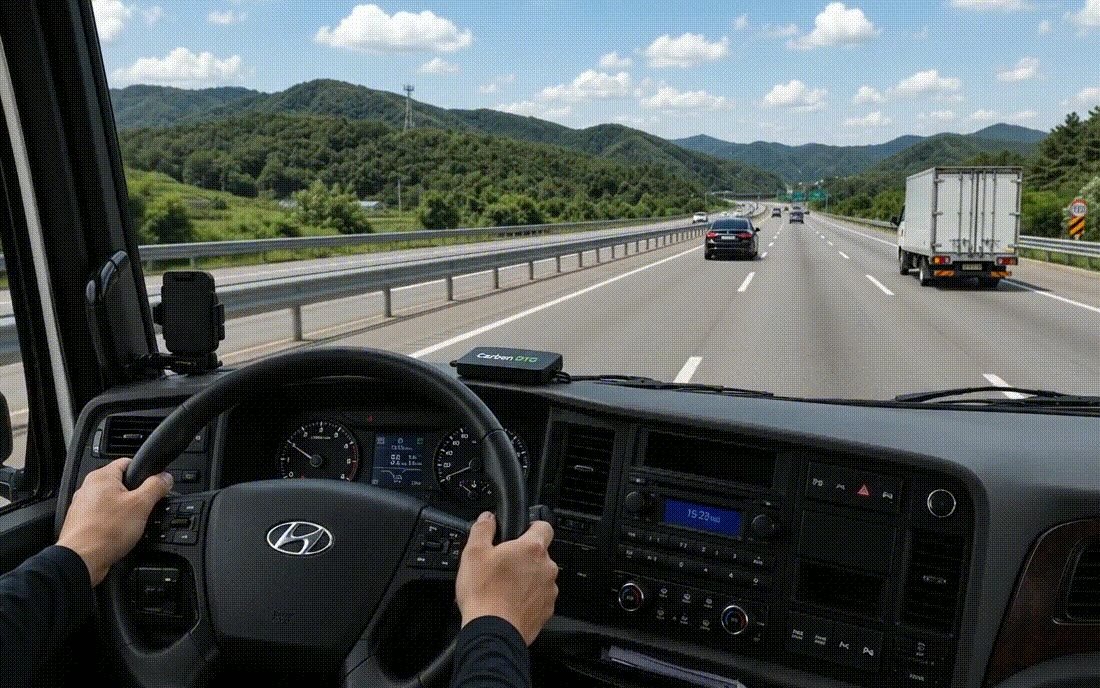
The digital tachograph (legally mandated trip recorder) does not record fuel or electricity consumption.

Primary contractors ask partner carriers for Excel files, and staff re-enter the data by hand.
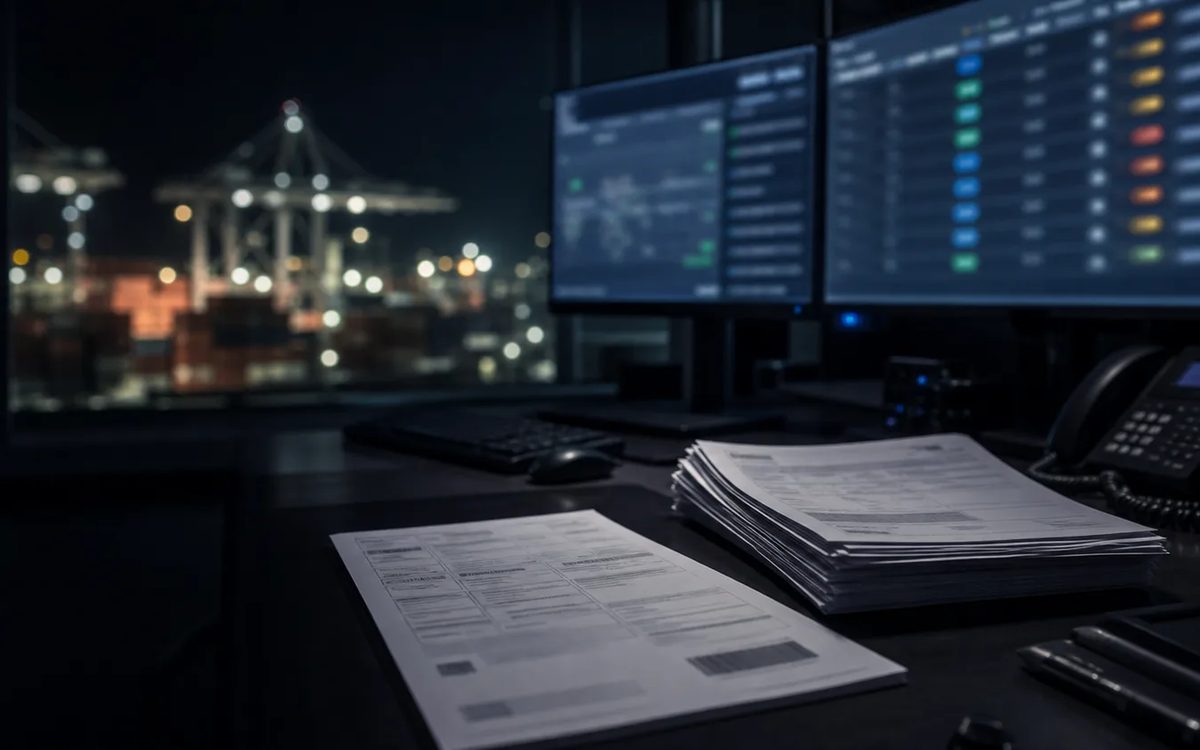
Fuel consumption reveals costs and trip records reveal accident liability, so subcontracted carriers refuse to submit them.
Carbon and safety
With the same raw data, primary contractors handleboth carbon reporting and safety monitoring
CarbonISO 14083 calculation and reporting
LTS Cloud calculates with Korean emission factors through the LCS engine. For heavy trucks, the results differ by 22% from products that use European factors.
Carbon solution →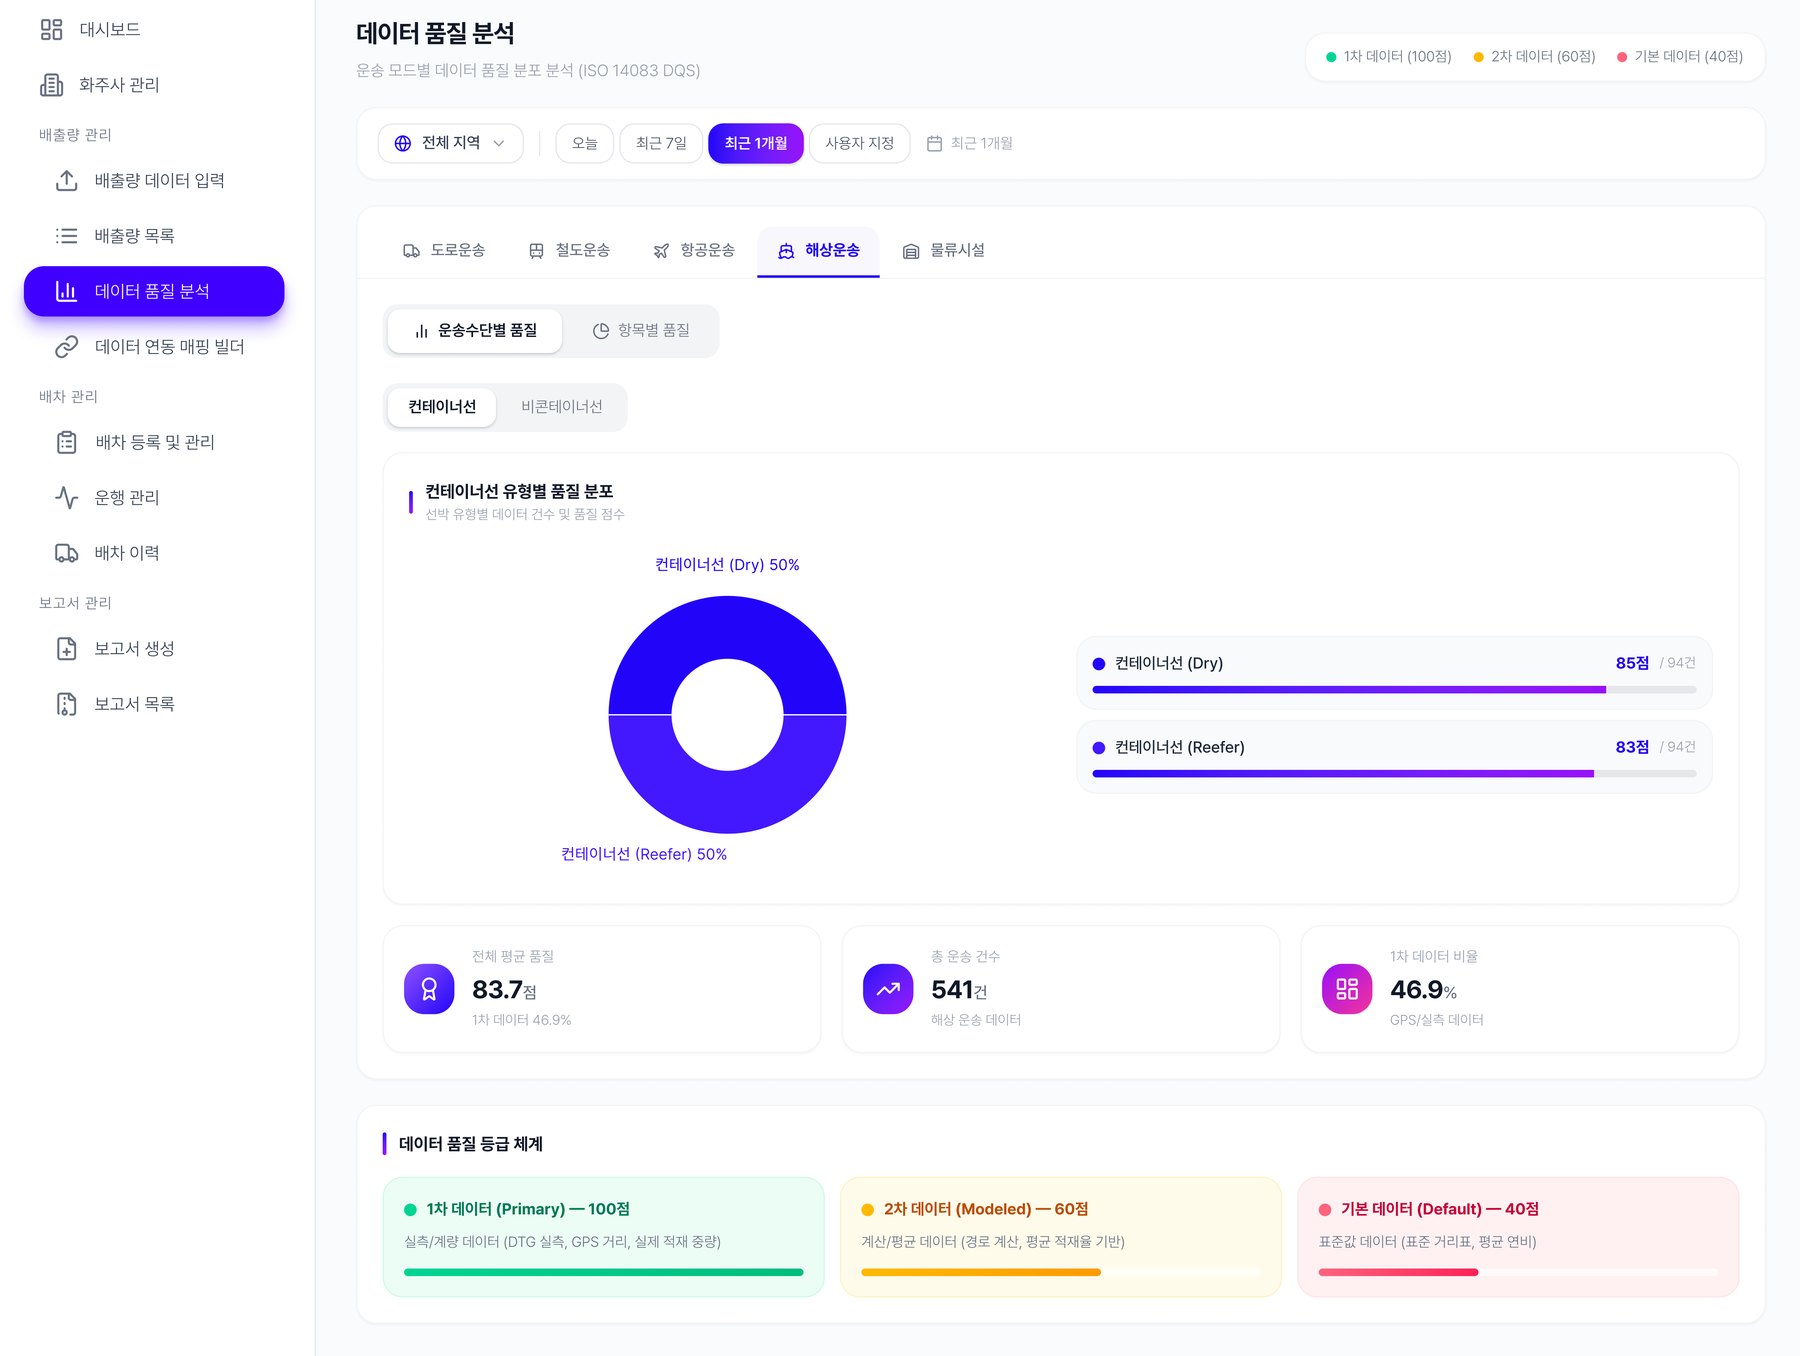
SafetyRisky-driving and hazardous-materials transport monitoring
LTS Cloud determines 11 types of risky driving with evidence waveforms, and primary contractors check transport conditions before the cargo arrives.
Safety solution →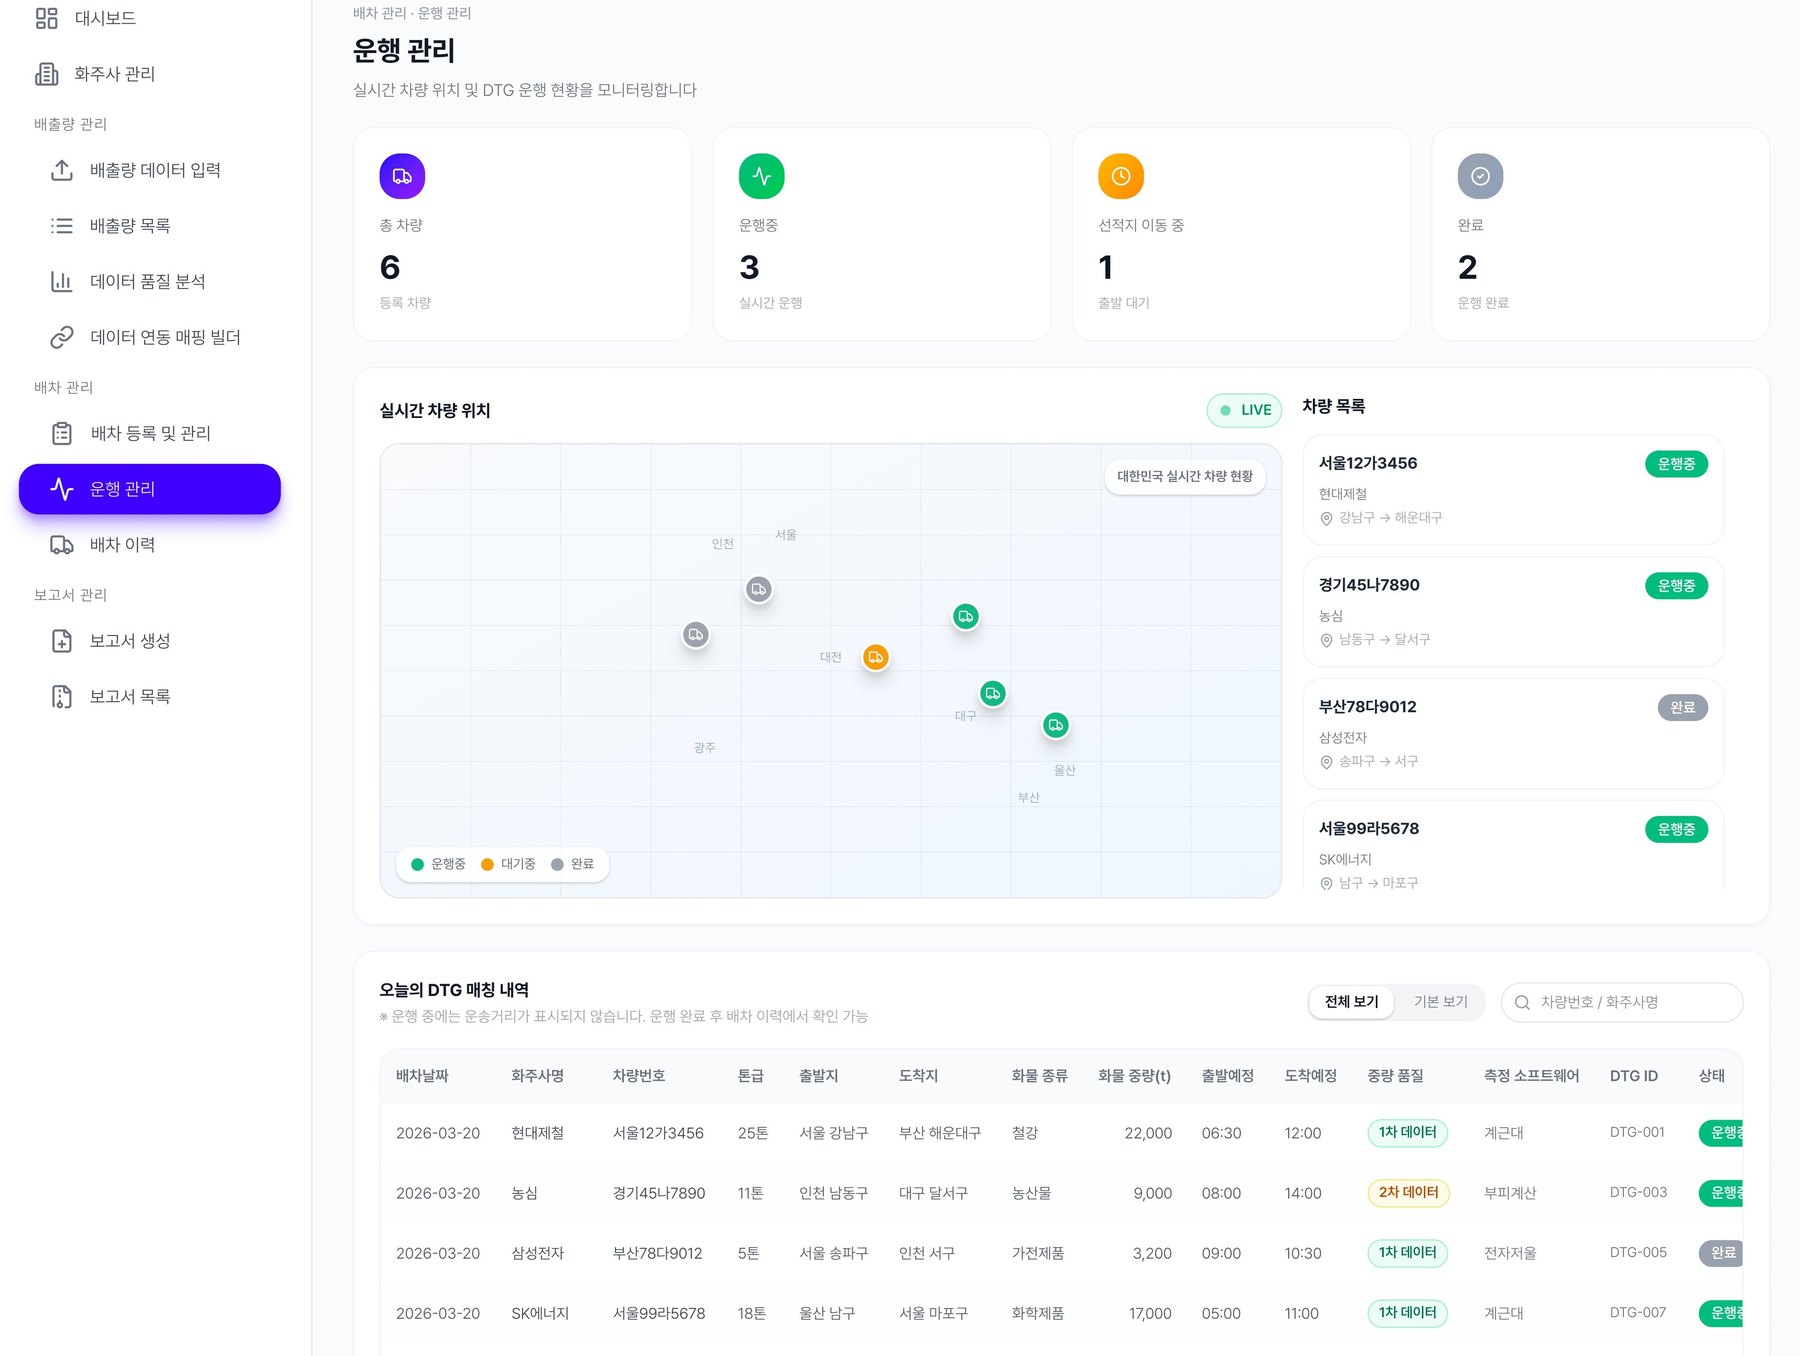
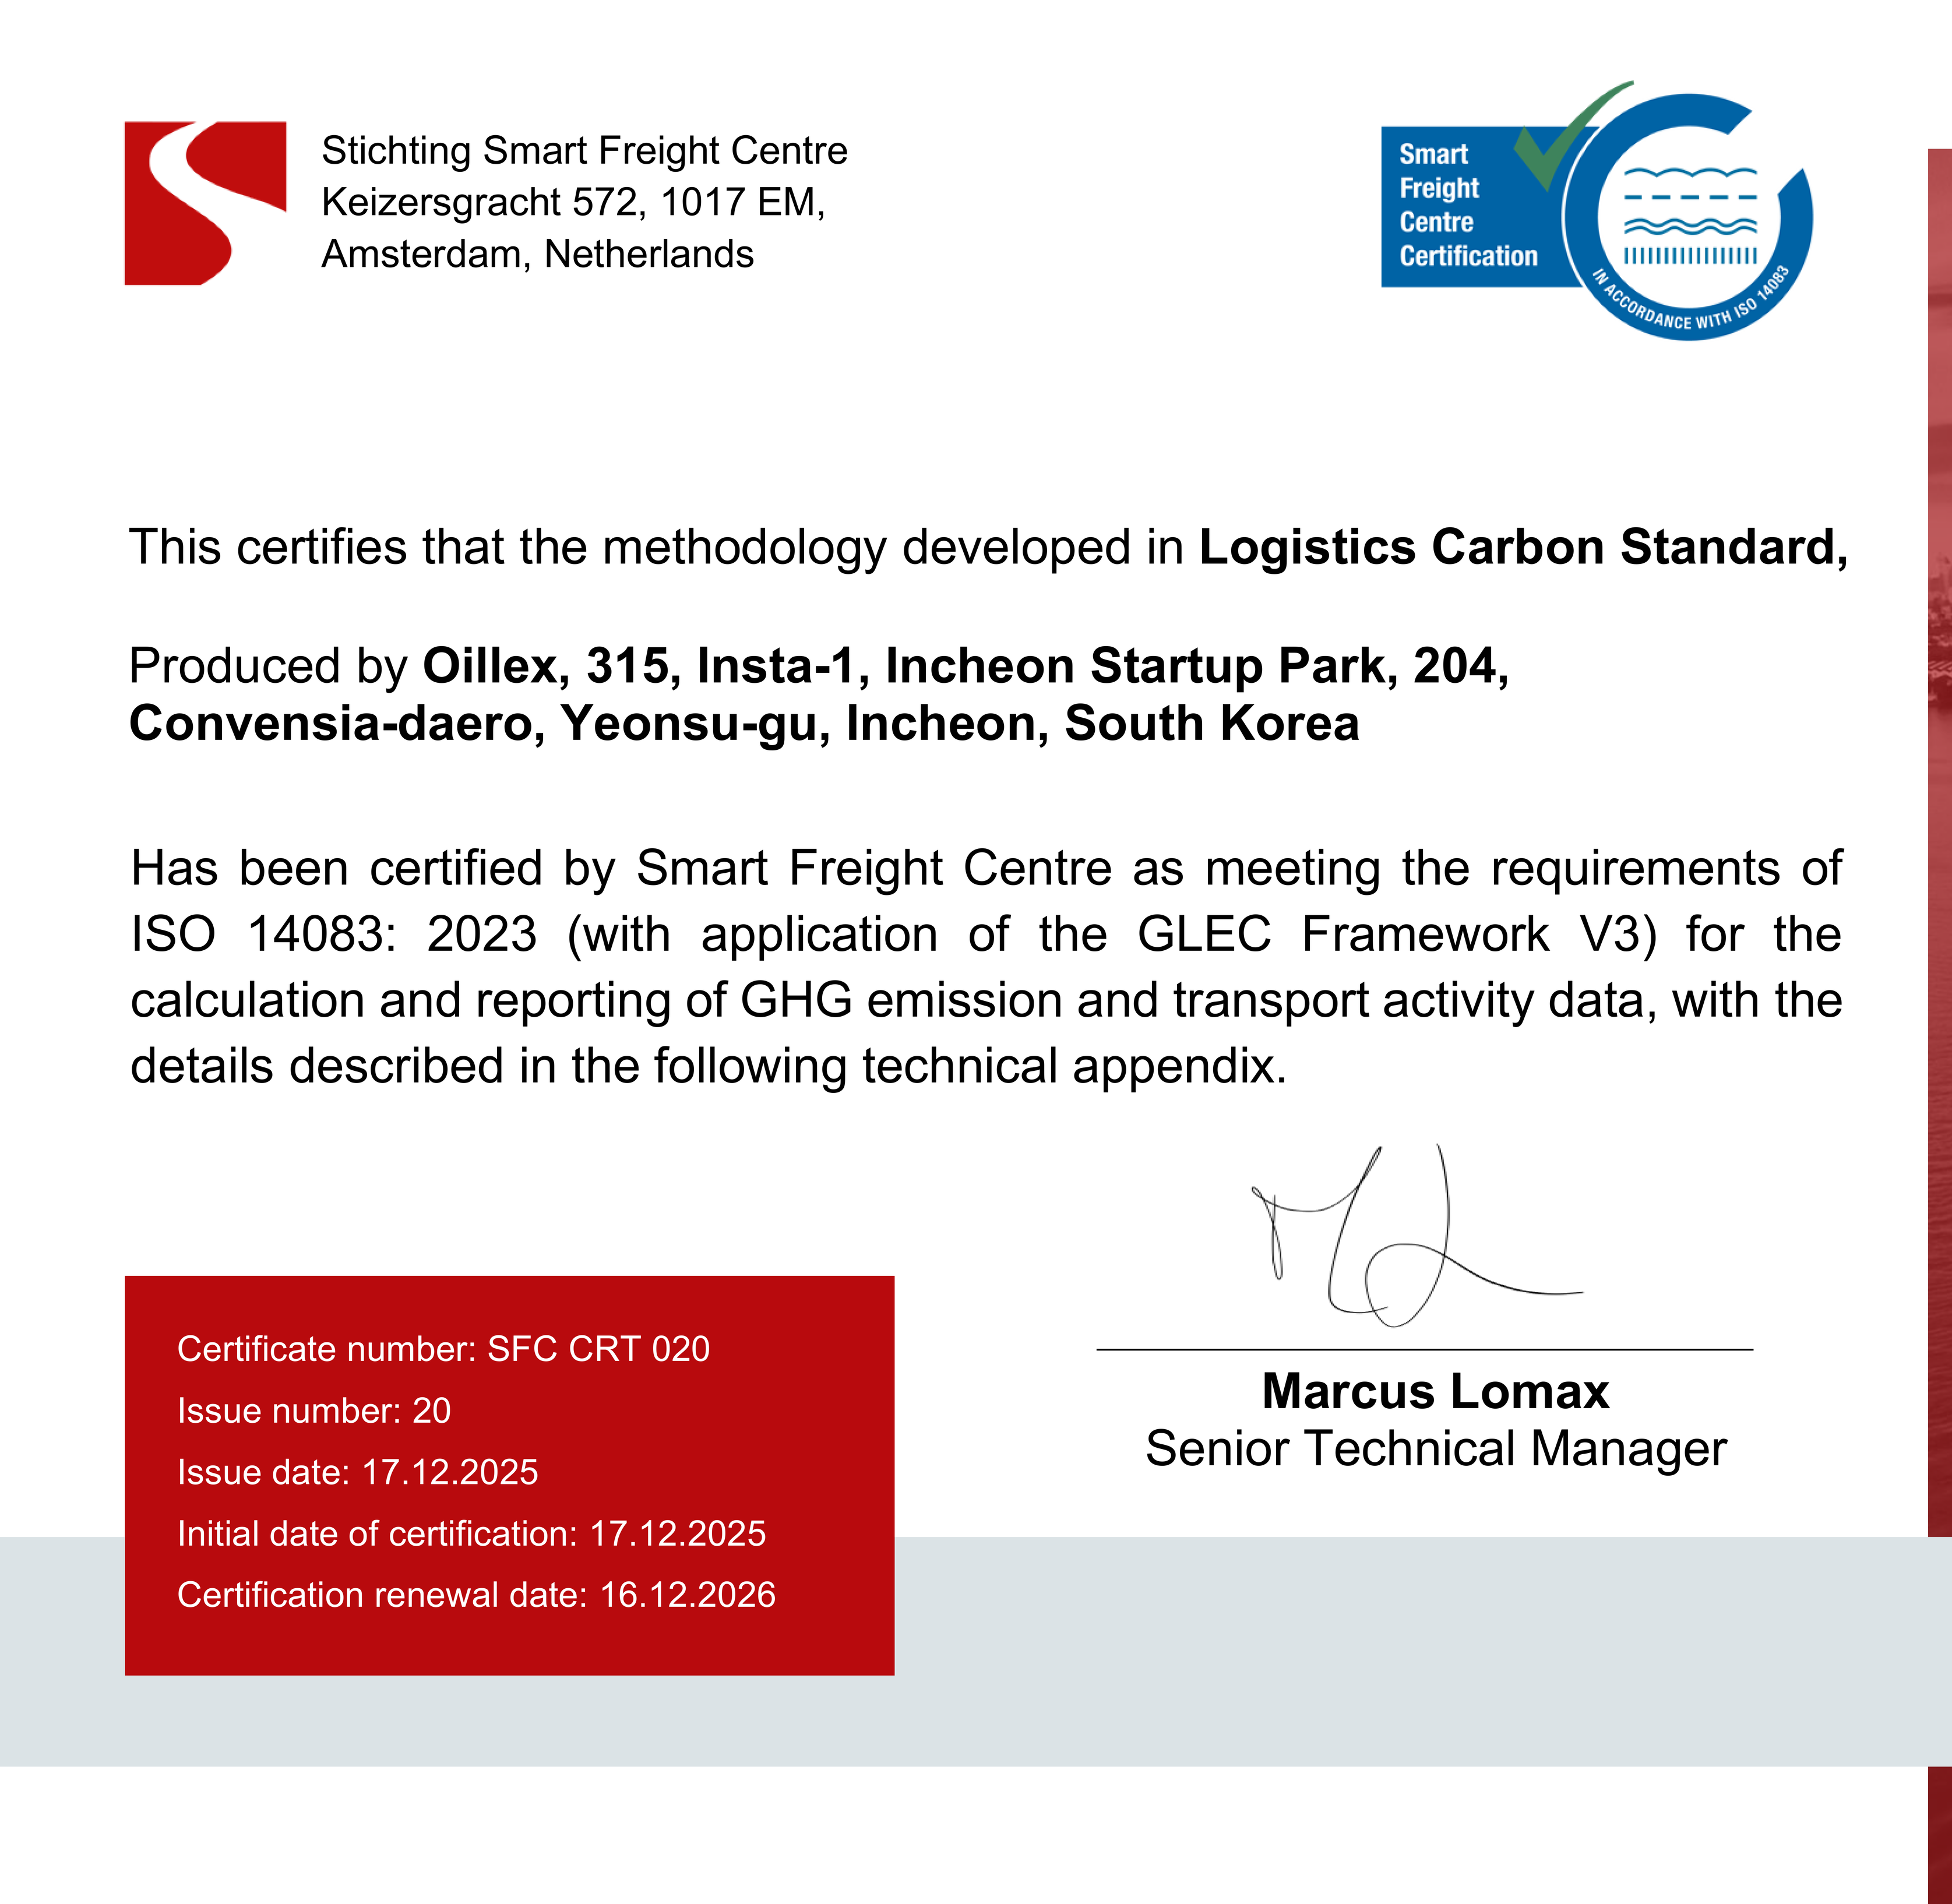
SFC certification CRT 020ISO 14083 · GLEC Framework
LTS Cloud is the first tool in Korea certified by SFC under the GLEC Framework.
CES 2026 Innovation AwardLTS AI DTG · AI tachograph
LTS AI DTG, an AI tachograph that determines 11 types of risky driving and impacts on the device in real time, received the CES 2026 Innovation Award.
View LTS AI DTG →
LTS Cloud
LTS offers LTS Cloud as two web services: one forprimary contractors, one for subcontracted carriers
LTS Cloud for primary contractor HQ
Primary contractor HQ receives the part of partner carriers' trip, fuel, electricity and risky-driving records that covers its own cargo, and issues emissions and safety records per shipper.
- Automatic collection of partner carriers' transport data
- Emissions and safety records issued per shipper
- Primary, secondary or default quality grade for each data point
LTS Cloud for subcontracted carriers
Subcontracted carriers manage trip records for their own vehicles and submit the data primary contractors request directly from LTS Cloud for carriers.
- Vehicle, driver and trip record management
- Submission of data requested by primary contractors
- Driver safe-driving report
Solutions
From primary contractor HQ to port equipment operators,LTS tailors the setup to each type of work
Primary contractor HQ collects transport data from partner carriers' vehicles directly in LTS Cloud.
Learn more →Subcontracted carriers submit the data primary contractors request directly through LTS Cloud for carriers.
Learn more →Bus operators issue EACs for electric-bus emission reductions and report measured reductions.
Learn more →Local governments manage measured reductions from local carriers' vehicles on one screen.
Learn more →Port authorities manage port-wide emissions with measured data from operators' equipment.
Learn more →Port equipment operators measure and record the fuel and electricity use of cargo-handling equipment.
Learn more →Companies and institutions we work with
Logistics companies and public institutions have startedmeasuring transport data with LTS







01 Collect · LTS DTG
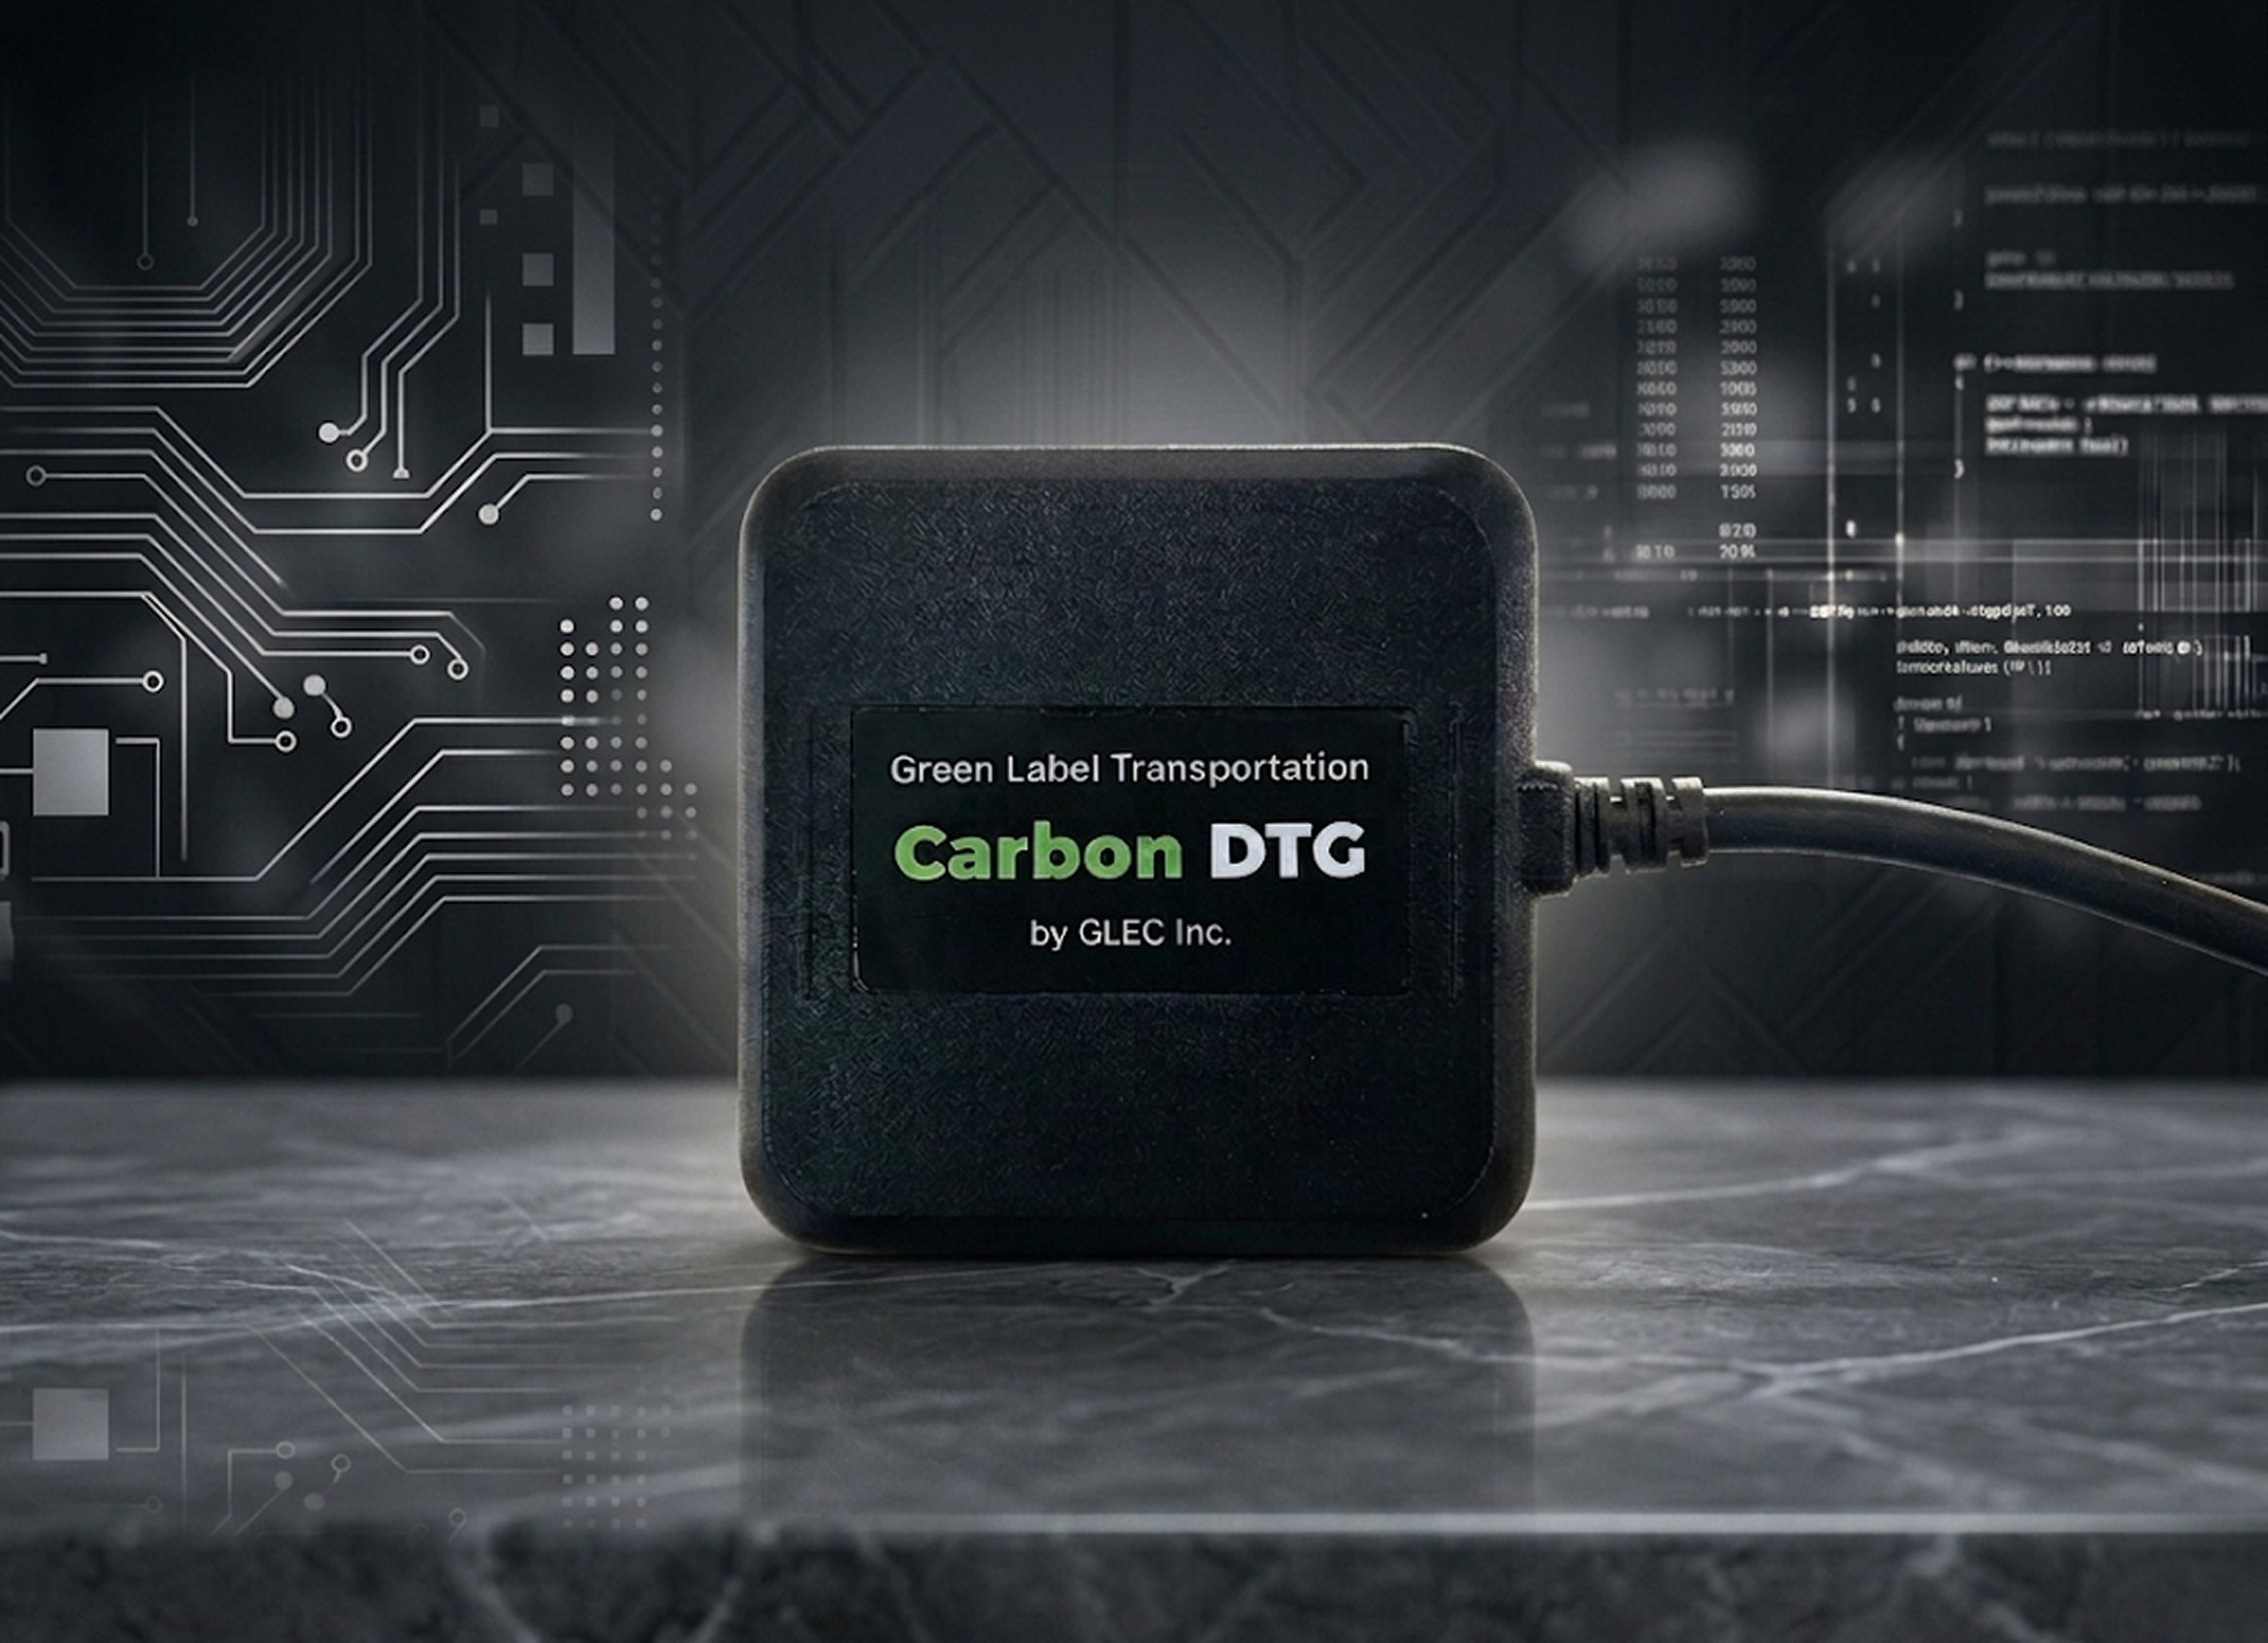
As the one legally mandated trip recorder, LTS DTGcollects the vehicle's CAN signals every 0.1 seconds
Carriers do not install an additional device. LTS DTG interprets fuel, electricity and trip data with 44 vehicle-model CAN profiles, and also collects battery signals from electric buses and cargo-handling equipment.
- CAN 0.1 s
- 44 vehicle-model CAN profiles
- Trip recorder type approval
02 Interpretation
LAS interprets manufacturer-specific CAN signals with 44vehicle-model profiles and outputs fuel and electricity use
Verified profiles are signed and distributed over the air (OTA), so carriers do not replace devices when they add new vehicle models.

LAS measured · 180 dispatches
The LAS engine resolved 180 dispatches in 5.0 seconds,35× and 95× faster than two frontier language models
LTS measurement 2026-09-29 · three sets of primary-contractor order spreadsheets, carrier dispatches, DTG trip records · median of 3 runs per engine · all three engines correct in all 3 runs · video at 60× speed
Part 2EACs · international transport insetting credits for EV transition
International transport insetting credits for EV transition (EACs)
Emissions actually reduced by electric buses and electric trucks become EACs on an international registry through LTS measurement
What EACs are
EACs are transport insetting credits for measured reductionsfrom electric transport, issued on an international registry
Cargo is carried by the original vehicle, and only the reduction attribute is recorded in the registry. Shippers buy these certificates and apply them to their own transport emissions reporting (Book & Claim). Issuance covers switching vehicles used for passenger and freight transport to electric.
- Book & Claim
- 1 tonne = 1 certificate
- Passenger and freight vehicles
Why now
EACs accept only the most recent year of reduction data,so reductions from years without issuance are lost
Regardless of when vehicles were switched to electric, issuance accepts only reduction data from the most recent year, and carriers issue EACs every year within 10 years of the vehicle's first purchase. Airlines also buy EACs for emissions reporting on their ground transport operations, such as buses and trucks.
Money lost every year
Carriers that switched to electric buses but do not issue EACslose about KRW 10.79 million per bus every year
Reductions from a year without issuance cannot be issued in a later year, so losses build up every year from the day of the switch to electric. As the number of vehicles grows, losses grow in the same proportion.
- Electric buses85.27 t per vehicle per year · Based on a measurement contractKRW 10.79 million every yearKRW 107.94 million over 10 years
- Electric yard tractor77.7 t per vehicle per year · Port authority sustainability reportKRW 9.84 million every yearKRW 98.36 million over 10 years
- Electric transfer crane144.2 t per vehicle per year · Measured in a registered offset projectKRW 18.25 million every yearKRW 182.54 million over 10 years
- Heavy electric truck31.9 t per vehicle per year · EstimateKRW 4.04 million every yearKRW 40.38 million over 10 years
Based on KRW 150,000 per tonne · amount received by the issuer after 123Carbon registration fees and LTS fees · heavy electric truck is an estimate · applies only to vehicles used for passenger and freight transport
Registration and trading
LTS is the official agent of 123Carbon and currentlythe only company issuing transport EACs in Korea
123Carbon
The only EACs registry in the world
Headquartered in Australia, it handles EACs registration and issuance for global logistics companies such as DHL and DP World.
Carboninsets
The only exchange for EACs
Issued EACs are traded here. It has signed a business cooperation NDA with LTS that goes further than an MOU.
LTS
Official agent of 123Carbon
Measures and calculates reductions with LTS DTG and LTS Cloud, and handles EACs issuance for Korean carriers.
Issuance process
Carriers issue and sell EACs in four steps:measurement, normalization, verification and registration
- 01
Measurement
LTS DTG collects electricity and trip data from electric vehicles.
- 02
Normalization
The LAS engine normalizes trip records and dispatches, and LTS Cloud uses the LCS engine to calculate reductions under ISO 14083. This takes about one month.
- 03
Verification
An independent verification body verifies the reductions and the calculation basis. This takes about one month.
- 04
Registration and sale
EACs are issued on the 123Carbon registry and sold on Carboninsets. This takes about one month.
The carrier issuing EACs pays the registry fees to the registry.
Issuance in progress
LTS is issuing EACs for 500 Sunjin Group electric buseswith 123Carbon for the first time
123Carbon is matching buyers in the United States.
LTS builds logistics standard technology for the AI transformationand carbon-neutral transition of Korean freight transport
Talk to us
LTS recommends a setup that fitsyour fleet size and partner-carrier structure
In a consultation, an LTS representative explains the scope and terms of adoption for your fleet size and partner-carrier structure.